Want more housing market stories from Lance Lambert’s ResiClub in your inbox? Subscribe to the ResiClub newsletter.
Nationally aggregated inventory is up +5.6% on a year-over-year basis between September 30, 2025 and September 30, 2026.
That marks three straight months where the year-over-year growth in active inventory for sale has accelerated. However, it’s only a tad acceleration from the low of +1.9% year-over-year inventory growth in June.
If you go back 12 months, the year-over-year national inventory growth rate was higher (+16.9%). Nonetheless, the continued growth in nationally aggregated inventory suggests a nationally aggregated housing market that’s soft, with buyers in many markets gaining some additional leverage over the past year.
And with long-term yields and mortgage rates back at a two-year high, we’ll be watching to see how much momentum the national softening regains as we head deeper into the seasonally slow period. We’re already starting to see it regain some momentum.
Nationally, we’re just shy of reaching back to pre-pandemic 2019 inventory levels (-5.2% below September 2019).
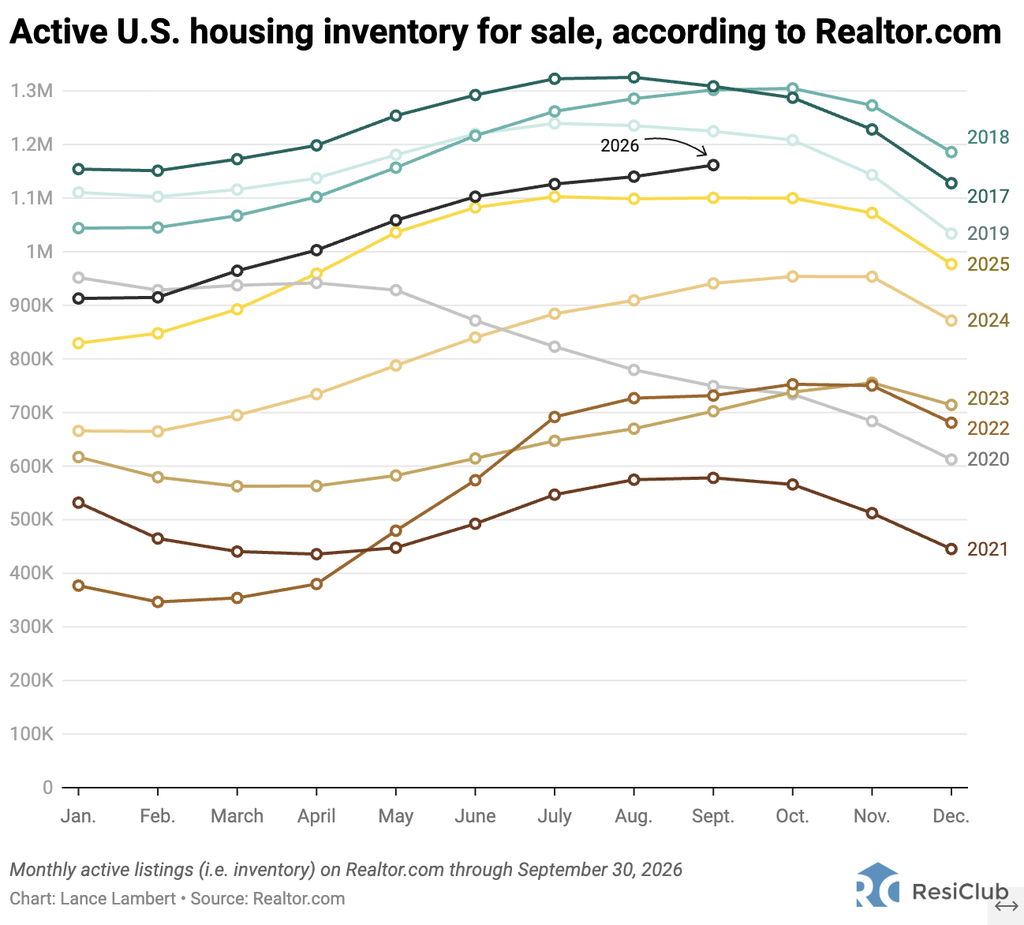
September inventory/active listings total, according to Realtor.com:
- September 2017 -> 1,308,607
- September 2018 -> 1,301,922
- September 2019 -> 1,224,868
- September 2020 -> 749,395 (Pandemic Housing Boom overheating)
- September 2021 -> 578,070 (Pandemic Housing Boom overheating)
- September 2022 -> 731,496
- September 2023 -> 702,430
- September 2024 -> 940,980
- September 2025 -> 1,100,407
- September 2026 -> 1,161,615
Between September 2024 and September 2025, U.S. active inventory across the country rose by +159,427 homes for sale.
Between September 2025 and September 2026, U.S. active inventory across the country rose by +61,208 homes for sale.
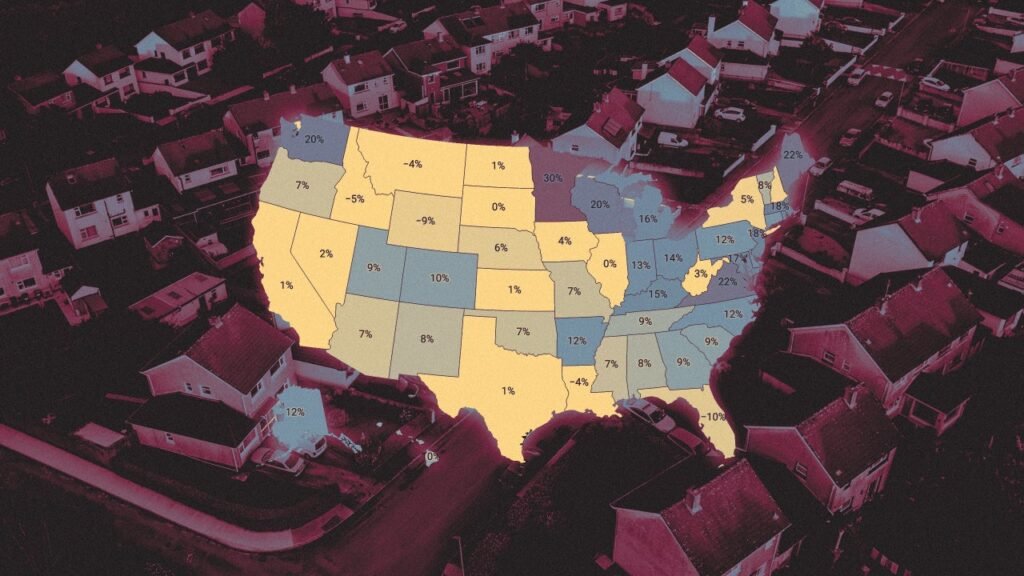
Below is the year-over-year active inventory percentage change by state.
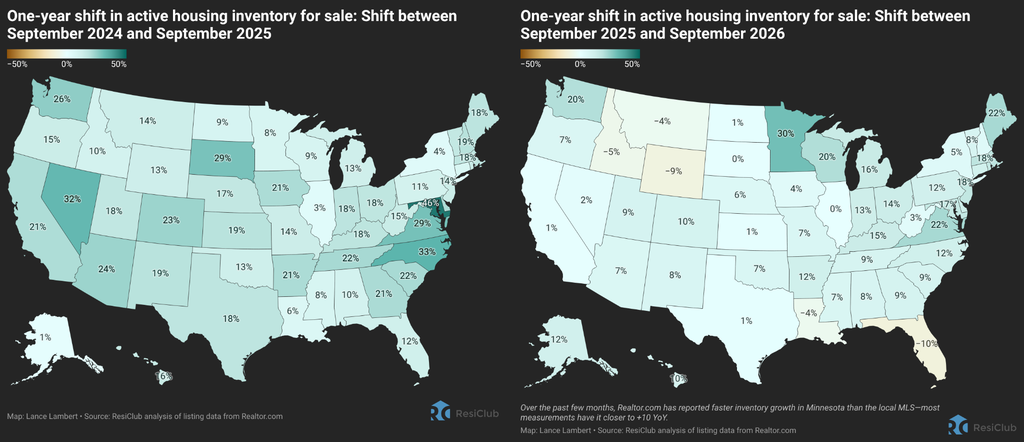
While active housing inventory is rising in most markets on a year-over-year basis, the pace of growth is more mild than a year ago (see the side-by-side maps below). In fact, Florida—home to many of the weakest regional housing markets over the past two years—is seeing active inventory edge down a little year-over-year (-10%).
LEFT: Year-over-year active inventory shift between September 2024 and September 2025
RIGHT: Year-over-year active inventory shift between September 2025 and September 2026
And while active housing inventory is rising in most markets on a year-over-year basis, some markets still remain tight-ish (just barely) even as they also soften.
As ResiClub has been documenting, both active resale and new homes for sale remain the most limited across certain parts of the Midwest and Northeast. That’s where home sellers over the past four years were more likely, relatively speaking, to have more power than their peers in many Southern markets.
In contrast, active housing inventory for sale has neared or surpassed pre-pandemic 2019 levels in many parts of the Sun Belt and Mountain West, including metro area housing markets such as Punta Gorda and Austin.
Many of these areas saw major price surges during the Pandemic Housing Boom, with home prices getting stretched compared to local incomes. As pandemic-driven domestic migration slowed and mortgage rates rose, markets like Punta Gorda and Austin faced challenges, relying on local income levels to support frothy home prices.
This softening trend was accelerated further by an abundance of new home supply in the Sun Belt. Builders are often willing to lower prices or offer affordability incentives (if they have the margins to do so) to maintain sales in a shifted market, which also has a cooling effect on the resale market: Some buyers, who would have previously considered existing homes, opting for new homes with more favorable deals over the past couple years—which then put some additional upward pressure on resale inventory.
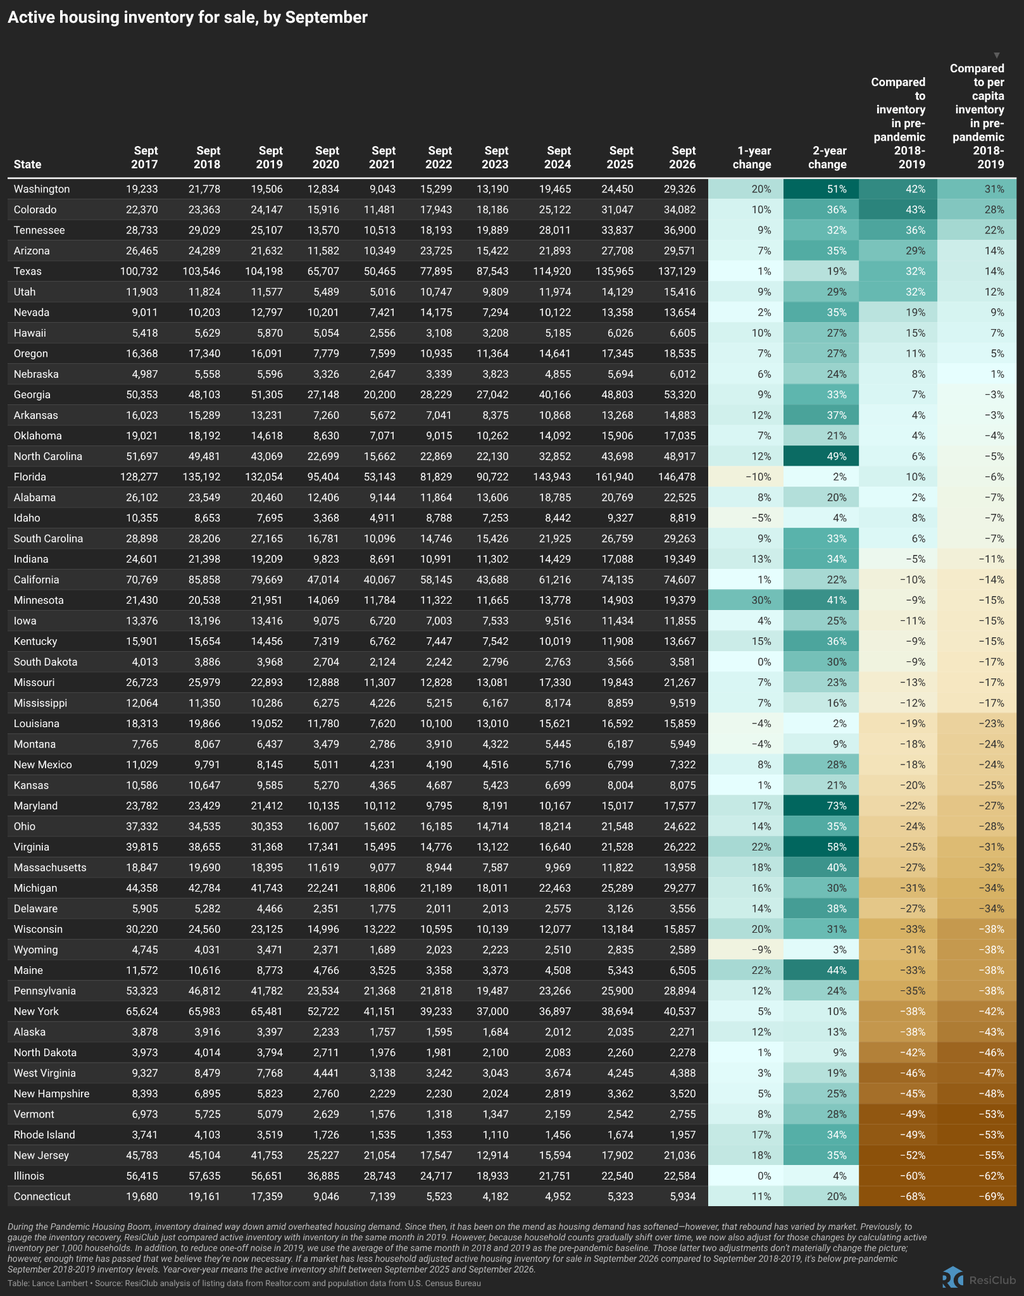
At the end of September 2026, 19 states were above pre-pandemic 2018-2019 active inventory levels: Alabama, Arizona, Arkansas, Colorado, Florida, Georgia, Hawaii, Idaho, Indiana, Nebraska, Nevada, North Carolina, Oklahoma, Oregon, South Carolina, Tennessee, Texas, Utah, and Washington. (The District of Columbia is also back above pre-pandemic 2019 active inventory levels too.)
Previously, to gauge the inventory recovery, ResiClub compared active inventory with inventory in the same month in 2019. However, because household counts gradually shift over time, we now adjust for those changes by calculating active inventory per 1,000 households. In addition, to reduce one-off noise in 2019, we use the average of the same month in 2018 and 2019 as the pre-pandemic baseline. Those latter two adjustments don’t materially change the picture; however, enough time has passed that we believe they’re now necessary.
At the end of September 2026, 10 states were above pre-pandemic 2018-2019 active inventory levels when adjusting for household count: Arizona, Colorado, Hawaii, Nebraska, Nevada, Oregon, Tennessee, Texas, Utah, and Washington (the District of Columbia is too). This cut (i.e., adjusting for per capita households) is the one we used in the map above.
Click here to view an interactive of the chart below (best done on desktop)
Big picture
The Pandemic Housing Boom saw a sharp overheating in U.S. home prices and a stretching of underlying fundamentals (i.e., compared to incomes)—especially once long-term yields and mortgage rates normalized after the ZIRP era.
That strained affordability has put upward pressure on national inventory. As inventory has built and nationally aggregated U.S. resale home price growth has fallen below the rate of U.S. income growth (i.e., falling “real” inflation-adjusted prices), we’re slowly seeing those underlying fundamentals improve.
In the boomtown markets—and new construction categories—that have seen outright nominal home price declines over the past four years, underlying fundamentals have improved faster. It just takes time for this post–Pandemic Housing Boom cyclical cooling window, and the recalibration of fundamentals, to play out. We’re still in that window.
Click here for an interactive version of the table below
Below is another version of the table above—but this one includes every month since January 2017.
Click here to view an interactive version of the chart below
If you’d like to further examine the monthly state inventory figures, use the interactive below.
As ResiClub has been closely documenting, Florida—which has been one of the epicenters of housing market weakness over the past 3 years, particularly in Southwest Florida—is no longer seeing the same upward burst in inventory.
Indeed, the intensity of Florida’s housing market correction is easing across many pockets of the state. There are still pockets of weakness in Florida, particularly in certain pockets of Southwest Florida, but the burst of softening has let up. Some builders have also reported that their affordability adjustments have helped them better meet the market in Florida. To really get a sense of the ZIP Code nuances, I recommend ResiClub clients using the ResiClub Terminal.