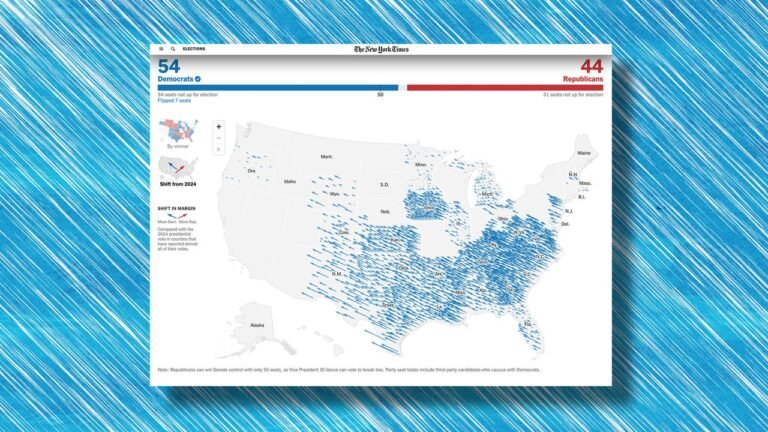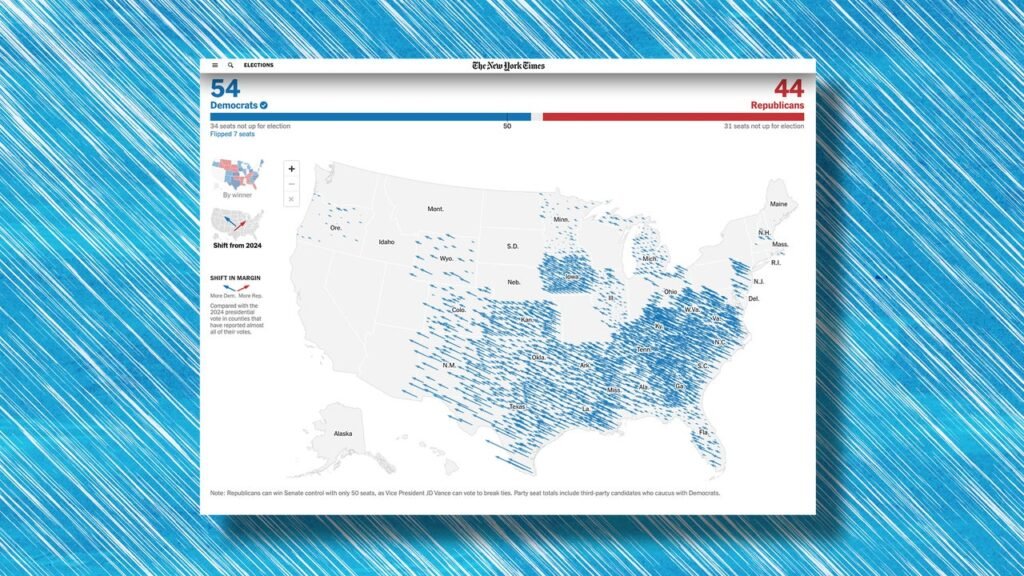
The 2026 election was a total political reset from 2024, with many states that voted for President Donald Trump last time swinging to the left and giving Democrats control of the next Congress. A pair of maps shows through arrows just how dramatic the change in just two years really was.
To communicate the shift in vote margin from one party to another from the most two recent elections, The New York Times has used an election results map with arrows that show the shift in each individual county where most votes are now counted. Blue arrows to the left show a trend towards Democrats compared to the last election while red arrows to the right show a trend towards Republicans. The longer the arrow, the bigger the shift. Two years ago, that map was covered in red. It’s now filled by a sea of blue arrows.
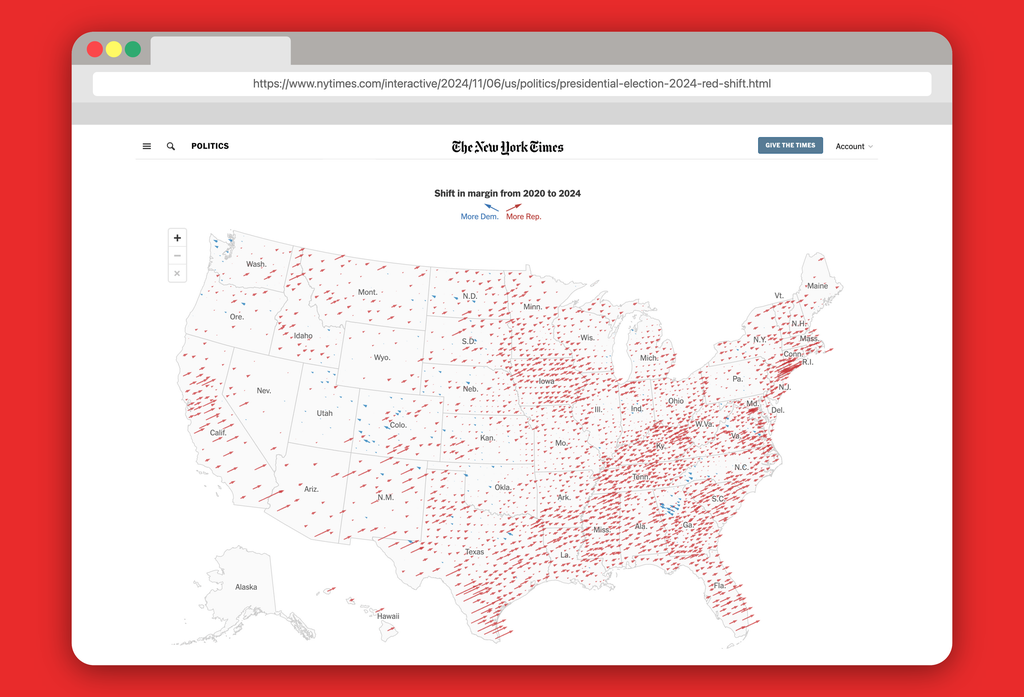
The Times first use the arrows map 10 years ago to show the vote shift in 2016, and Times graphics editor Wilson Andrews told Fast Company in 2024 the style “adds another layer of storytelling.” While typical election map graphics show you the winner or vote share, this map conveys a sense of time, giving viewers a look at how much political attitudes changed from one Election Day to another.
Trump won the national popular vote in 2024 after making campaign promises to lower prices and avoid foreign wars, but in office he did the opposite, by illegally imposing tariffs and launching a war with Iran. These policy decisions raised costs, as did broad government corruption, pet construction projects that cost hundreds of millions of dollars, and his administration’s overly aggressive immigration enforcement tactics, which flipped many Latino voters he’d won in the previous election cycle.
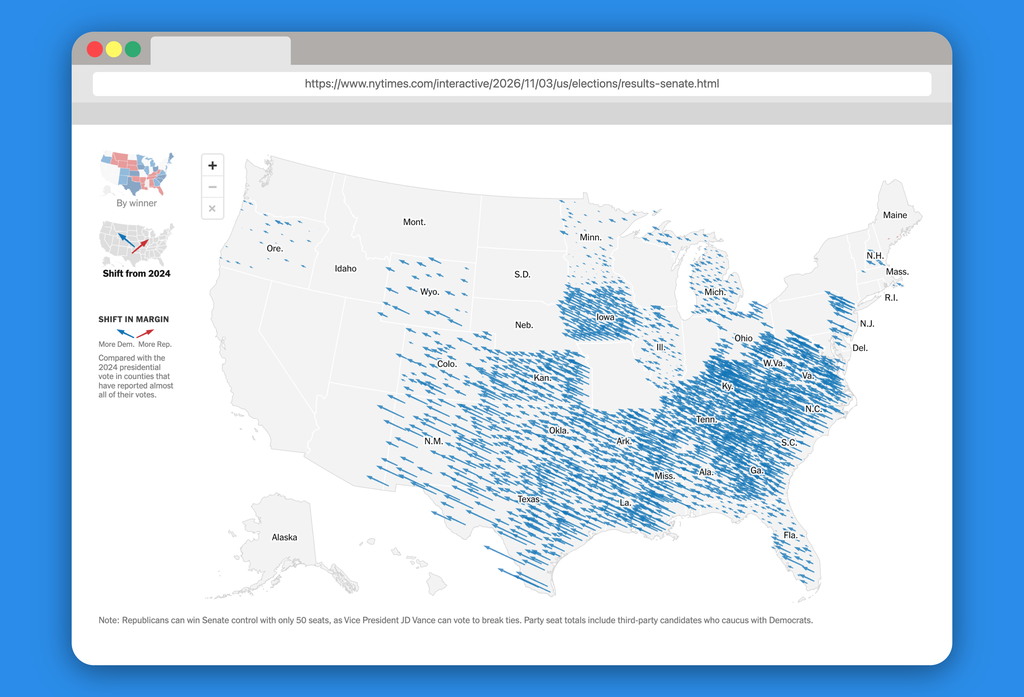
In just two years, Trump’s positive approval rating dropped near its lowest ever—and is the lowest net approval rating for any incumbent president in a midterm since polling began. Tuesday’s results shows what that means from county to county in stark terms.
The Times shift map is an especially compelling piece of data visualization to depict upsets, because it subverts what we’re used to seeing from standard red-blue election results maps. Instead of just “red states” and “blue states,” that show you the winner, it shows where in the country the vote has most swung. The 2026 map shows tiny blue arrows in Democratic strongholds like Oregon, because the vote margin shift wasn’t that great, while in places we’re used to seeing always colored in red, like Texas or Kansas, the longest blue arrows blanket the state.
Democratic House Leader Hakeem Jeffries called Tuesday a “change election,” and Democrats pulled off wins Tuesday in historically Republican places: Annie Andrews became the first Democrat to win a U.S. Senate seat in South Carolina since 1998, James Talarico became the first in Texas since 1988, and Adam Hamilton became the first in Kansas since 1932. Branding themselves as centrists, these Democrats ran in an especially unfavorable year for Republicans tied to an unpopular president that many of them didn’t even want to mention.
Showing election results through the shift in margin has become a popular form of data viz, and other outlets like The Economist and NBC News did their own versions of the map this year too. The story of U.S. midterms is one of buyers’ remorse, and long blue arrows in deep red states quickly show just how forcefully much of the American electorate wanted a refund.